

The best available estimate for the U.S. median RN salary in 2026 is $97,550 per year, or roughly $46.90 per hour. That figure comes directly from BLS Occupational Employment and Wage Statistics (OEWS) May 2025 data, the most current official release, and it serves as the strongest single anchor for planning and negotiation. A moderate growth projection from the May 2024 baseline of $93,600 lands in the same range, which gives you two independent data points pointing to the same number.
That said, the national median is a starting point, not a final answer. State, specialty, employer type, and experience level can push your actual pay well above or below $97,550. The sections below show exactly how that estimate was built, where the spread comes from, and how to convert a national figure into a number you can defend in a real negotiation.
At a glance:
- 2026 estimated median RN salary: $97,550/year (~$46.90/hr)
- Official BLS May 2024 baseline: $93,600/year
- 10th percentile (May 2024): $66,030 | 90th percentile: $135,320
- 93% of nurses say pay isn't keeping pace with economic demands
Table of Contents
- What is the median RN salary for 2026, and how was it projected?
- What the official BLS baseline tells you about RN pay
- What factors will affect your RN pay by 2026?
- How does median RN pay vary by state and specialty?
- How to use salary data in your next job search or negotiation
- Where to find the most current 2026 RN salary data
- Key Takeaways
- The number you need, and what to do with it
- HighPaidRN gives you the localized data public sources can't
What is the median RN salary for 2026, and how was it projected?
Two data anchors support the 2026 estimate. The first is the BLS OEWS May 2024 release, which set the official median at $93,600. The second is the May 2025 OEWS release, which reported a median of $97,550 and a mean of $101,420. Because the May 2025 data is already available, it functions as a near-real-time 2026 anchor rather than a projection.
For nurses who want to stress-test that number, three simple growth scenarios applied to the $93,600 May 2024 baseline produce the following results:
| Scenario | Annual Growth Rate | Projected 2026 Median |
|---|---|---|
| Conservative | — | $97,550 |
| Moderate | 6% | ~$98,300 |
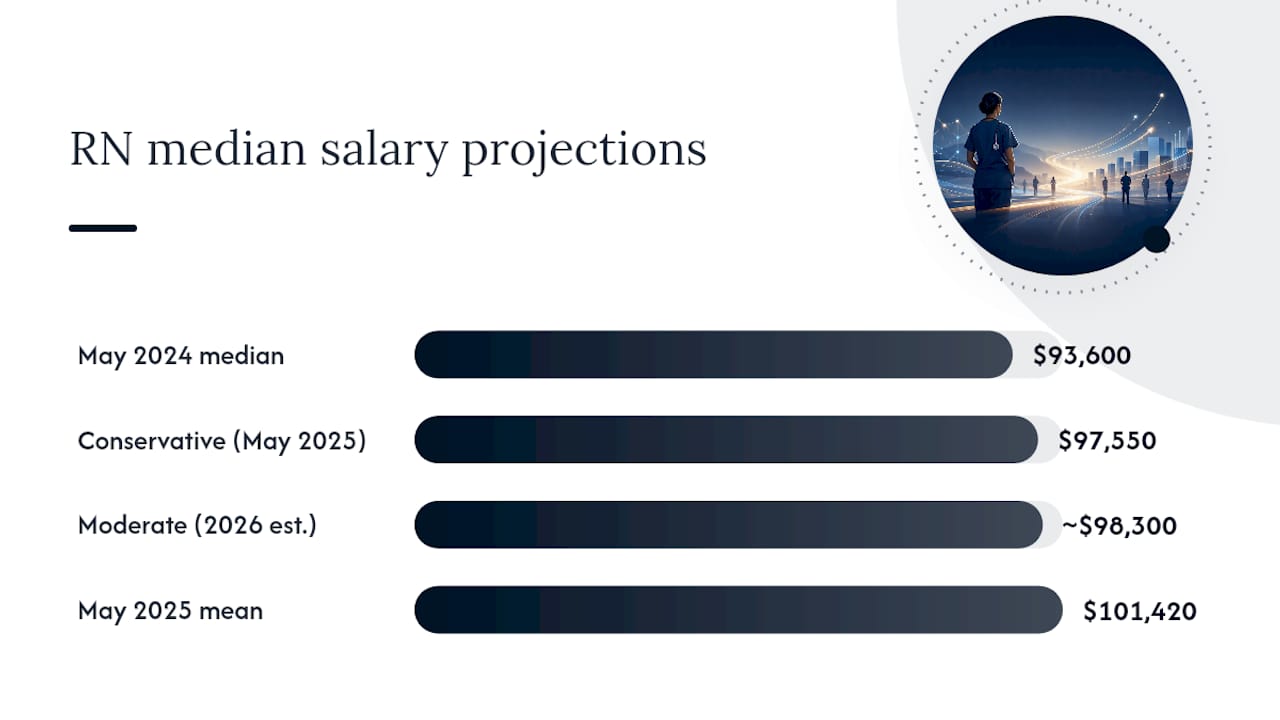
Moderate scenario math: $93,600 × 1.025 = $95,940 (2025 estimate) × 1.025 = ~$98,300 (2026 estimate). The assumptions are a stable nursing labor market, continued staffing shortages, and no major policy shock to Medicare/Medicaid reimbursement rates.
The conservative scenario aligns closely with the already-published $97,550 May 2025 figure, which is why that number carries the most weight. Use the high scenario only if you are in a high-demand specialty or a tight-labor metro market.
What the official BLS baseline tells you about RN pay
The BLS OEWS program is the gold standard for occupational wage data in the U.S. Its May 2024 snapshot for registered nurses shows:
- Job outlook: — 6% growth projected through 2033
The median matters more than the mean for typical pay expectations because the mean gets pulled upward by high earners in expensive metro areas and specialized roles. If you want to know what a typical staff RN earns, the median is the right number to anchor to. The $97,550 May 2025 figure from U.S. News Careers and other OEWS-derived sources confirms the upward trajectory from the $93,600 May 2024 baseline, and both feed directly into the projection scenarios above.
What factors will affect your RN pay by 2026?
The national median masks a spread that can easily run $40,000 or more between the bottom and top of the distribution. These are the variables that move your number:
- Specialty: — ICU, OR, and ER nurses command a premium over general med-surg. Travel nurses working 13-week contracts often earn $2,000–$3,000 per week in total compensation, well above staff nurse rates, though without the same benefits stability.
- Shift differentials and overtime: — Night, weekend, and holiday differentials can add $5–$10/hr to effective hourly pay. Heavy overtime in short-staffed units can push annual earnings significantly above base salary.
- Policy and economic trends: Ongoing labor negotiations, Medicare/Medicaid reimbursement adjustments, and state-level nurse-to-patient ratio legislation will all influence where nursing salary trends land by the end of 2026.
How does median RN pay vary by state and specialty?
State and specialty variation is where the national median becomes most useful as a reference point rather than a target. The table below shows a sample of state-level ranges and selected specialty premiums based on available OEWS and survey data.

| State / Specialty | Typical Median Range | Notes |
|---|---|---|
| California | $135,320+ | Highest state median nationally |
| Texas | $78,610–$107,960 | Large variation by metro vs. rural |
| New York | $93,600–$107,960 | NYC metro pulls state median up |
| Florida | — | Below national median; high volume |
| Washington | $93,600–$107,960 | Strong union presence |
| ICU (national) | $93,600–$107,960 | Premium over general med-surg |
| OR (national) | $93,600–$107,960 | Specialty training commands premium |
| Travel RN | $66,030–$135,320 | Wide range; contract and location dependent |
Geographic variation is the single largest driver of the spread. A metro-area median in San Jose or Seattle can run $30,000–$40,000 above the national figure, while rural markets in the South or Midwest sit well below it.
How to check your state's actual numbers:
- Go to the BLS OEWS data tool and filter by state, then by metro area
- Pull the 25th, 50th, and 75th percentile figures, not just the median
- Cross-reference with your state's labor department for the most localized data
- Filter by employer type (hospital vs. outpatient vs. long-term care) when the tool allows
- Prioritize metro-area data over state averages if you work in or near a major city
How to use salary data in your next job search or negotiation
Knowing the median is only useful if you can translate it into a number you're willing to say out loud. Here's a practical sequence:
- Establish your baseline. Pull the BLS OEWS median for your state and specialty. Note the 25th and 75th percentiles.
- Set a percentile target. For competitive metro markets, aim for the 60th–75th percentile. For rural or lower-cost markets, the 50th–60th percentile is a defensible starting point.
- Account for total compensation. Factor in shift differentials, sign-on bonuses, PTO accrual, and retirement match before comparing offers. Two positions with the same base pay can differ by $10,000+ in total annual value.
- Define your walk-away number. Know the minimum base you'll accept before the conversation starts.
Sample negotiation scripts:
- Initial offer response: "Thank you for the offer. Based on BLS OEWS data for this metro area and verified peer data, the 65th percentile for this specialty is $X. Can we get closer to that range?"
- Counteroffer: "I'd like to propose $X as a base. I can share the percentile data I'm working from if that's helpful."
- Asking for a market adjustment: "The BLS data for our region shows the median has moved to $97,550. I'd like to discuss aligning my base to reflect that shift."
Pro Tip: Present your data as a printed or PDF one-pager: BLS percentile for your state, your specialty's typical range, and one peer-verified figure from a source like HighPaidRN. Hiring managers respond better to a document than a verbal claim.
For deeper preparation, the salary negotiation guide for nurses on HighPaidRN's blog walks through evidence framing and timing in detail.
Where to find the most current 2026 RN salary data
- BLS OEWS — (bls.gov): The official source, updated annually each spring. Strongest for national and state medians and percentile breakdowns. Slower to reflect real-time market shifts.
- Peer salary surveys — (Nurse.org, specialty associations): Timely and specialty-specific, but sample sizes vary. The Nurse.org 2026 survey drew 3,758 respondents, which is a reasonable sample for trend analysis.
- Job boards — (Indeed, LinkedIn, Glassdoor): Real-time but self-reported and unverified. Use for directional signals, not hard benchmarks.
When evaluating any dataset, check three things: sample size, date range, and whether the figures are self-reported or verified. A dataset of 200 self-reported salaries from two years ago is far less reliable than a BLS OEWS release or a verified peer database. The Rippling 2026 analysis makes a useful point: state-level segmentation matters as much as the national figure when setting hiring budgets or negotiation targets.
Key Takeaways
The projected median RN salary for 2026 is $97,550 nationally, but your actual pay depends on state, specialty, and employer type, making percentile-based research and verified peer data the most reliable tools for negotiation.
| Point | Details |
|---|---|
| 2026 median estimate | BLS OEWS May 2025 data sets the national median at $97,550/year (~$46.90/hr). |
| Percentile spread | The 25th percentile sits at $78,610 and the 75th at $107,960, a significant gap that reflects real variation. |
| State and specialty matter | California medians can exceed $135,000; ICU and OR nurses typically earn above the national median. |
| Negotiation anchor | Target the 60th–75th percentile for competitive markets; use BLS data and verified peer figures as evidence. |
| HighPaidRN for localized data | HighPaidRN's verified, anonymized database filters by state, specialty, and setting for peer-level salary comparisons. |
The number you need, and what to do with it
The $97,550 national median is a useful benchmark, but it's not the number that should drive your negotiation. What actually moves the needle is knowing where you sit within the distribution for your specific state, specialty, and employer type.
Most nurses I see underuse percentile data. They find the national median, compare it to their current salary, and stop there. The more productive question is: what does the 65th or 75th percentile look like for an ICU nurse in your metro area, at a union hospital, with five years of experience? That number is almost always higher than the national median, and it's the number you should be citing in a negotiation.
The 93% of nurses who say their pay isn't keeping up with economic demands aren't wrong. But the solution isn't just awareness. It's showing up to a negotiation with a specific, sourced number and a clear rationale for why you belong above the median. Verified peer data, filtered by specialty and setting, is what makes that case credible. The BLS gives you the floor. Peer-verified, localized data tells you how high the ceiling actually is.
HighPaidRN gives you the localized data public sources can't
The BLS median tells you where the national market stands. HighPaidRN tells you what nurses in your specialty, your state, and your type of facility are actually earning right now.
The platform's verified, anonymized salary database lets you filter by state, specialty, hospital type, and employment condition, so you're comparing yourself to true peers rather than a national average that includes rural Mississippi and downtown San Francisco in the same number. Every data point is contributed anonymously by working nurses, which means the figures reflect real compensation, not posted job ranges.
Use HighPaidRN alongside BLS OEWS data for the strongest possible negotiation position: the official anchor from a government source, plus peer-verified specifics that speak directly to your market. Search the HighPaidRN database to see what nurses in your specialty and state are earning, and add your own salary to strengthen the data for every nurse who comes after you.
This article provides general compensation information for educational purposes. Salary figures vary by employer, location, and individual circumstances. Confirm current figures with BLS OEWS or a qualified compensation professional before making career decisions.